SL Paper 3
Amino acids are the building blocks of proteins.
Draw the dipeptide represented by the formula Ala-Gly using section 33 of the data booklet.
Deduce the number of 1H NMR signals produced by the zwitterion form of alanine.
Outline why amino acids have high melting points.
Students were asked to investigate how a change in concentration of hydrochloric acid, HCl, affects the initial rate of its reaction with marble chips, CaCO3.
They decided to measure how long the reaction took to complete when similar chips were added to 50.0 cm3 of 1.00 mol dm−3 acid and 50.0 cm3 of 2.00 mol dm−3 acid.
Two methods were proposed:
(1) using small chips, keeping the acid in excess, and recording the time taken for the solid to disappear
(2) using large chips, keeping the marble in excess, and recording the time taken for bubbles to stop forming.
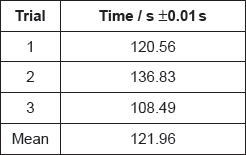
A group recorded the following results with 1.00 mol dm−3 hydrochloric acid:
Annotate the balanced equation below with state symbols.
CaCO3(__) + 2HCl(__) → CaCl2(__) + CO2(__) + H2O(__)
Neither method actually gives the initial rate. Outline a method that would allow the initial rate to be determined.
Deduce, giving a reason, which of the two methods would be least affected by the chips not having exactly the same mass when used with the different concentrations of acid.
State a factor, that has a significant effect on reaction rate, which could vary between marble chips of exactly the same mass.
Justify why it is inappropriate to record the uncertainty of the mean as ±0.01 s.
If doubling the concentration doubles the reaction rate, suggest the mean time you would expect for the reaction with 2.00 mol dm−3 hydrochloric acid.
Another student, working alone, always dropped the marble chips into the acid and then picked up the stopwatch to start it. State, giving a reason, whether this introduced a random or systematic error.
Analytical techniques are very useful in determining molecular structures. A compound, X, has the empirical formula \({{\text{C}}_{\text{2}}}{{\text{H}}_{\text{4}}}{\text{O}}\).
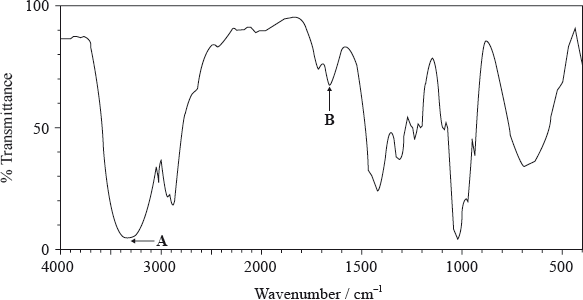
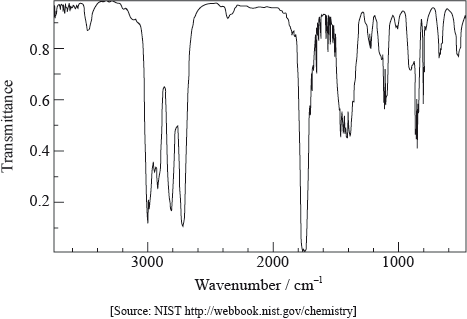
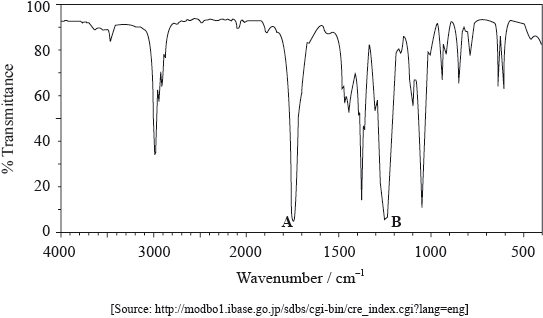
The molecular formula of X is \({{\text{C}}_{\text{4}}}{{\text{H}}_{\text{8}}}{{\text{O}}_{\text{2}}}\). The information in the IR spectrum below can be used to help determine the structure of X.
The \(^{\text{1}}{\text{H}}\,{\text{NMR}}\) spectrum of X shows three peaks with relative areas of 2:1:1.
Identify the analytical technique that would most readily provide the additional data required to calculate the molecular formula of X.
(i) State what information about a molecule can be obtained from its IR spectrum.
(ii) Deduce the information obtained from absorptions A and B.
A:
B:
(iii) Comment on the absence of any major absorption in the region 1700–1750 \({\text{c}}{{\text{m}}^{ - 1}}\).
(i) Deduce what information can be obtained from these data.
(ii) Deduce the structure of X.
Infrared spectroscopy is commonly used as an analytical technique by inorganic, physical and organic chemists.
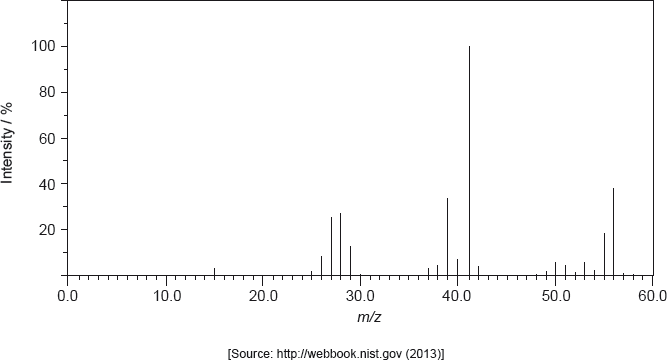
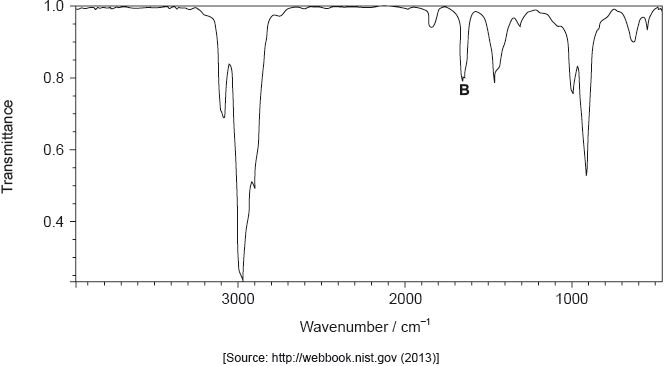
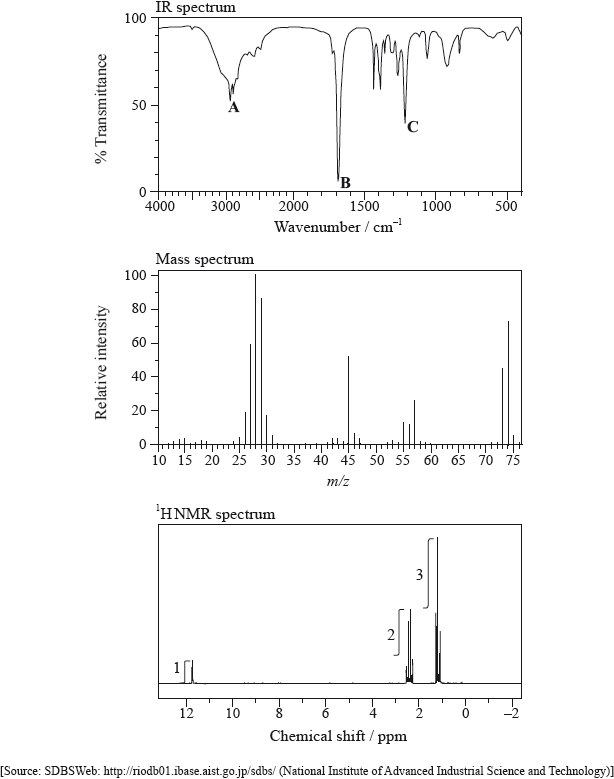
The IR spectrum, mass spectrum and \(^{\text{1}}{\text{H}}\,{\text{NMR}}\) spectrum of an unknown compound, X, of molecular formula \({{\text{C}}_{\text{5}}}{{\text{H}}_{{\text{10}}}}{{\text{O}}_{\text{2}}}\), are as follows.
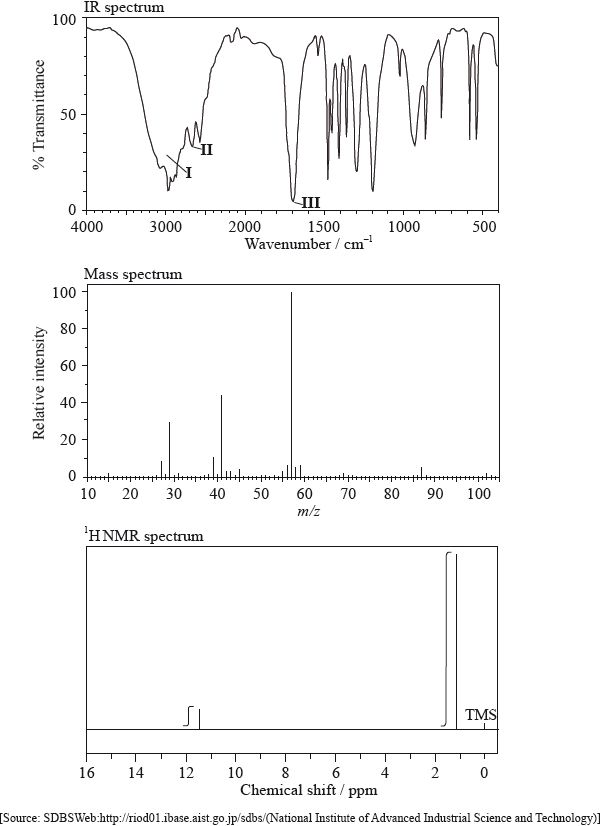
In the IR spectrum, identify the bond responsible for each of the absorptions labelled I, II and III.
I:
II:
III:
In the mass spectrum, deduce which fragments the m/z values at 102, 57 and 45 correspond to.
m/z =102:
m/z = 57:
m/z = 45:
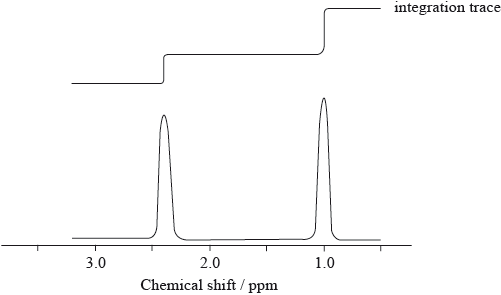
Identify the peak at 11.5 ppm in the \(^{\text{1}}{\text{H}}\,{\text{NMR}}\) spectrum.
State what information can be obtained from the integration traces in the \(^{\text{1}}{\text{H}}\,{\text{NMR}}\) spectrum about the hydrogen atoms responsible for the peak at 1.2 ppm.
Deduce the structure of X.
\({\text{C}}{{\text{H}}_{\text{3}}}{\text{COOC}}{{\text{H}}_{\text{2}}}{\text{C}}{{\text{H}}_{\text{2}}}{\text{C}}{{\text{H}}_{\text{3}}}\) is an isomer of X. Deduce two differences between the \(^{\text{1}}{\text{H}}\,{\text{NMR}}\) spectrum of this isomer and that of X.
Distinguish between the \(^{\text{1}}{\text{H}}\,{\text{NMR}}\) spectra of 1-bromopropane and 2-bromopropane (splitting patterns are not required).
The structures of oseltamivir (Tamiflu) and zanamivir (Relenza) are given in section 37 of the data booklet.
Compare and contrast the structures of oseltamivir and zanamivir, stating the names of functional groups.

Deduce the wavenumber of one absorbance seen in the IR spectrum of only one of the compounds, using section 26 of the data booklet.
Suggest one ethical consideration faced by medical researchers when developing medications.
Mass spectrometry is a powerful analytical technique used in the identification of organic compounds. The mass spectrum of a compound with empirical formula \({\text{C}}{{\text{H}}_{\text{2}}}{\text{O}}\) displays peaks at m/z 15, 45 and 60.
Determine the molecular formula of the compound.
Identify the fragments responsible for the peaks at
m/z = 15
m/z = 45
Identify a compound that could produce this spectrum.
Medicines have a variety of different effects on the body and act at the molecular level.
Morphine and codeine are strong analgesics. Their structures are given in section 37 of the data booklet.
Dose response curves are determined for each drug.
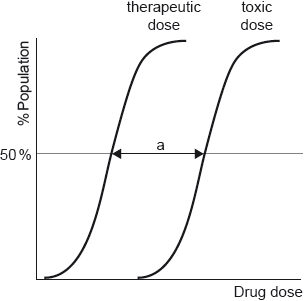
Outline the significance of range “a”.
Suggest the type of reaction used to convert morphine to codeine.
State and explain the action of opiates as painkillers.
Infrared spectroscopy is an analytical technique that uses electromagnetic radiation.
The infrared spectrum of a substance, X, with empirical formula \({{\text{C}}_{\text{3}}}{{\text{H}}_{\text{6}}}{\text{O}}\) is given below.
Explain why the structural formula of X cannot be:
The \(^{\text{1}}{\text{H}}\,{\text{NMR}}\) spectrum of X consists of three peaks. Deduce the structural formula of X and the relative areas under each peak.
Magnetic resonance imaging (MRI) is a medical application of NMR spectroscopy.
State one advantage of MRI over X-ray medical imaging with reference to the electromagnetic spectrum.
Outline how MRI is used to scan the human body.
Deduce the number of peaks in the \(^{\text{1}}{\text{H}}\,{\text{NMR}}\) spectra of 1-bromobutane and 2-bromobutane. Explain how the integration trace can be used to distinguish between the two compounds.
Compare the \(^{\text{1}}{\text{H}}\,{\text{NMR}}\) spectrum of 1-bromo-2-methylpropane with the two spectra considered in (a). Include the number of peaks and the integration trace.
Details of the \(^{\text{1}}{\text{H}}\,{\text{NMR}}\) spectra of two of these alcohols are given below.
\[\begin{array}{*{20}{l}} {Spectrum 1}&{} \\ {{\text{Two peaks:}}}&{{\text{One at 1.3 ppm (relative to the TMS reference) with an integration trace}}} \\ {}&{{\text{of nine units, and the other at 2.0 ppm with an integration trace of one unit.}}} \\ {Spectrum 2}&{} \\ {{\text{Four peaks:}}}&{{\text{The first at 0.9 ppm with an integration trace of six units.}}} \\ {}&{{\text{The second at 1.7 ppm with an integration trace of one unit.}}} \\ {}&{{\text{The third at 2.1 ppm with an integration trace of one unit.}}} \\ {}&{{\text{The fourth at 3.4 ppm with an integration trace of two units.}}} \end{array}\]
Consider the proton environments present in each of the alcohol molecules when answering the following questions.
The mass spectrum of one of the alcohols shows peaks at m/z values of 74, 59 and 45.
(i) Identify which alcohol gives spectrum 1 and explain your answer by stating which hydrogen atoms in the molecule are responsible for each of the two peaks.
(ii) Deduce which alcohol gives spectrum 2. Explain which particular hydrogen atoms in the molecule are responsible for the peaks at 0.9 ppm and 3.4 ppm.
(i) Deduce which two of the alcohols could produce this spectrum and identify the species responsible for the three peaks.
(ii) The spectrum also shows a significant peak at m/z = 31. Suggest which alcohol is responsible for this spectrum and deduce the species responsible for the peak at m/z = 31.
Explain why the infrared spectra of all four alcohols are very similar.
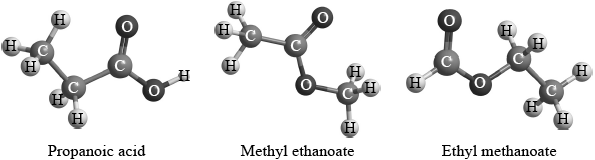
Three isomers of \({{\text{C}}_{\text{3}}}{{\text{H}}_{\text{6}}}{{\text{O}}_{\text{2}}}\) are ethyl methanoate, methyl ethanoate and propanoic acid.
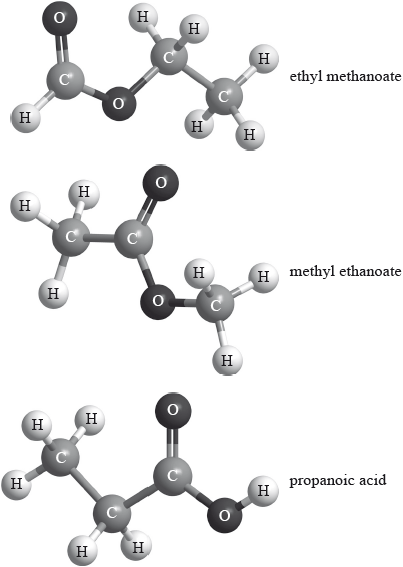
Explain which of the three compounds has a mass spectrum which contains peaks at \(m{\text{/}}z = 59\) and 44.
NMR spectroscopy is one of the most powerful analytical tools for determining molecular structure.
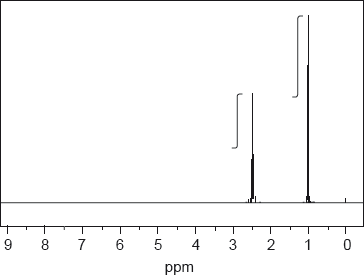
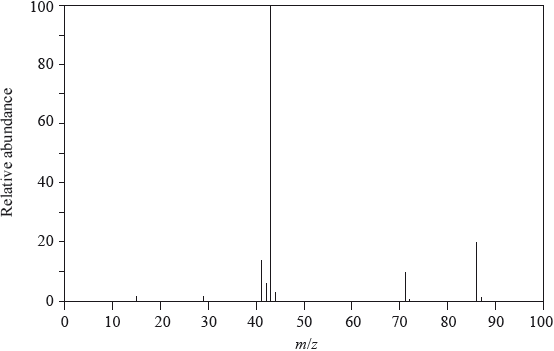
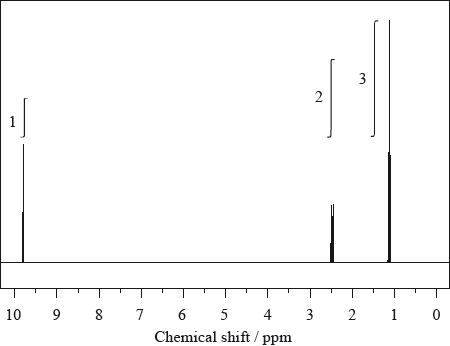
The 1H NMR spectrum, including the integration trace, of a ketone with relative molecular mass 86 is shown below.
[Source: SDBS web: www.sdbs.riodb.aist.go.jp (National Institute of
Advanced Industrial Science and Technology, 2014)]
Deduce the structural formula of the compound, justifying your choice.
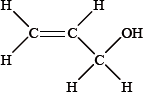
Consider the compound chloroethene, CH2=CHCl.
Deduce two features you would expect to observe in its mass spectrum.
Predict two features you would expect to observe in its infrared (IR) spectrum.
The structure of an unknown compound A with empirical formula CH2 can be determined using information from a variety of analytical techniques.
The mass spectrum of A is shown below.
The infrared (IR) spectrum of A is shown below.
Determine the relative molecular mass of the compound from the mass spectrum and deduce the formula of the molecular ion.
Deduce the formulas of the fragments which give rise to peaks at \(m/z = 27\) and 29.
\(m/z = 27\):
\(m/z = 29\):
Identify the bond responsible for the IR absorption at B.
Deduce a structural formula consistent with the data.
The low resolution \(^1{\text{H}}\,{\text{NMR}}\) spectrum of compound Q is shown.
Identify what information from the spectrum allows the determination of the relative numbers of hydrogen atoms producing each peak.
Deduce which of the following compounds is Q.
\[{\text{C}}{{\text{H}}_{\text{3}}}{\text{C}}{{\text{H}}_{\text{2}}}{\text{C}}{{\text{H}}_{\text{3}}}\quad \quad \quad \quad \quad {\text{C}}{{\text{H}}_{\text{3}}}{\text{C}}{{\text{H}}_{\text{2}}}{\text{COC}}{{\text{H}}_{\text{2}}}{\text{C}}{{\text{H}}_{\text{3}}}\quad \quad \quad \quad \quad {\text{C}}{{\text{H}}_{\text{3}}}{\text{C}}{{\text{H}}_{\text{2}}}{\text{OH}}\]
Identify the wavenumbers of two peaks in the infrared spectrum of compound Q, using Table 17 of the Data Booklet.
A student wished to determine the concentration of a solution of sodium hydroxide by titrating it against a 0.100moldm−3 aqueous solution of hydrochloric acid.
4.00g of sodium hydroxide pellets were used to make 1.00dm3 aqueous solution.
20.0cm3 samples of the sodium hydroxide solution were titrated using bromothymol blue as the indicator.
Outline, giving your reasons, how you would carefully prepare the 1.00dm3 aqueous solution from the 4.00g sodium hydroxide pellets.
(i) State the colour change of the indicator that the student would see during his titration using section 22 of the data booklet.
(ii) The student added the acid too quickly. Outline, giving your reason, how this could have affected the calculated concentration.
Suggest why, despite preparing the solution and performing the titrations very carefully, widely different results were obtained.
A healthy diet consists of a range of food groups in the right proportions that provide the energy for the body to function, grow and repair itself.
Examples of straight-chain fatty acids include \({{\text{C}}_{{\text{19}}}}{{\text{H}}_{{\text{39}}}}{\text{COOH}}\), \({{\text{C}}_{{\text{19}}}}{{\text{H}}_{{\text{31}}}}{\text{COOH}}\) and \({{\text{C}}_{{\text{19}}}}{{\text{H}}_{{\text{29}}}}{\text{COOH}}\).
State the empirical formula and structural features of monosaccharides.
Deduce the structural formula of a triester formed from three long-chain carboxylic acid molecules, RCOOH, and one propane-1,2,3-triol molecule, \({\text{HO–C}}{{\text{H}}_{\text{2}}}{\text{CH(OH)–C}}{{\text{H}}_{\text{2}}}{\text{OH}}\). Identify one of the ester linkages in the structure by drawing a rectangle around it.
Deduce the number of C=C bonds present in one molecule of each fatty acid.
\({{\text{C}}_{{\text{19}}}}{{\text{H}}_{{\text{39}}}}{\text{COOH}}\):
\({{\text{C}}_{{\text{19}}}}{{\text{H}}_{{\text{31}}}}{\text{COOH}}\):
\({{\text{C}}_{{\text{19}}}}{{\text{H}}_{{\text{29}}}}{\text{COOH}}\):
Explain what occurs at a molecular level during the absorption of infrared (IR) radiation by the sulfur dioxide molecule, \({\text{S}}{{\text{O}}_{\text{2}}}\).
Consider the IR spectra of the following three compounds.
\[\begin{array}{*{20}{l}} {{\text{A}} = {\text{C}}{{\text{H}}_{\text{3}}}{{{\text{(C}}{{\text{H}}_{\text{2}}}{\text{)}}}_{\text{3}}}{\text{COOH}}} \\ {{\text{B}} = {\text{C}}{{\text{H}}_{\text{3}}}{\text{COOC(C}}{{\text{H}}_{\text{3}}}{{\text{)}}_{\text{3}}}} \\ {{\text{C}} = {{{\text{(C}}{{\text{H}}_{\text{3}}}{\text{C}}{{\text{H}}_{\text{2}}}{\text{)}}}_{\text{3}}}{\text{COH}}} \end{array}\]
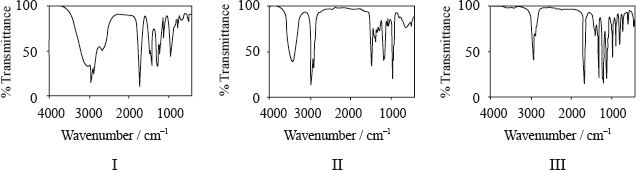
Determine which IR spectrum corresponds to each compound A, B and C. Explain your reasoning. IR data can be found in Table 17 of the Data Booklet.
Compound X has the molecular formula \({{\text{C}}_{\text{3}}}{{\text{H}}_{\text{6}}}{{\text{O}}_{\text{3}}}\) and is found in human perspiration.
Y is an isomer of X, which contains the same functional groups.
Its infrared (IR) spectrum is represented below.
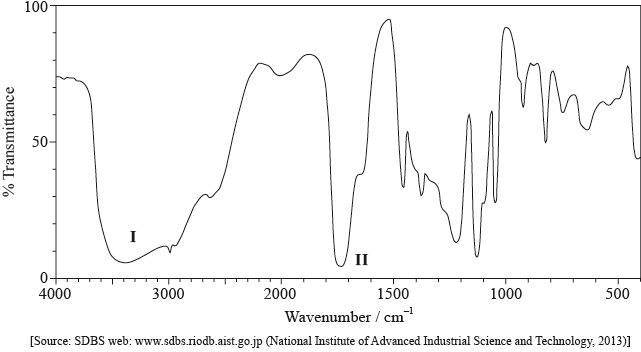
Deduce the bonds responsible for the absorptions labelled I and II.
I:
II:
The \(^{\text{1}}{\text{H}}\,{\text{NMR}}\) spectrum recorded showed four peaks with the following chemical shift values (in ppm):
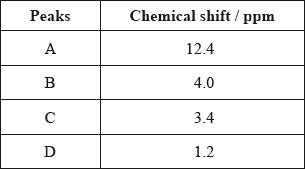
The integration trace for A:B:C:D was found to be 1:1:1:3.
Deduce what information can be obtained about the hydrogen atoms responsible for peak D at 1.2 ppm from the integration trace in the \(^{\text{1}}{\text{H}}\,{\text{NMR}}\) spectrum of X.
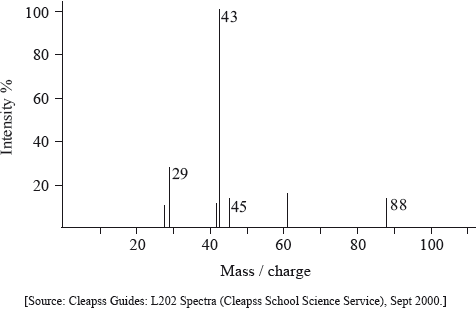
Deduce the fragments in the mass spectrum which correspond to the following m/z values.
m/z = 45:
m/z = 17:
m/z = 15:
Deduce the structural formula of X.
(i) Deduce the structural formula of Y.
(ii) Predict one difference between the \(^{\text{1}}{\text{H}}\,{\text{NMR}}\) spectrum of Y and X.
(i) Like X, 3-methylbutanoic acid is also a source of body odour. Deduce the m/z value for the molecular ion peak on the mass spectrum of this compound.
(ii) Deduce the number of different chemical environments of the hydrogen atoms in the \(^{\text{1}}{\text{H}}\,{\text{NMR}}\) spectrum of 3-methylbutanoic acid.
The mass spectrum of an unknown compound, X, of empirical formula C2H4O is shown below.
The IR spectrum of X is shown below.
Determine the relative molecular mass of X from the mass spectrum and deduce the formula of the molecular ion.
Identify a fragment which gives rise to the peak at m/z = 29.
Comment on the absence of a peak at m/z = 59.
Use Table 17 of the Data Booklet to identify the bonds which correspond to the absorptions A and B.
A:
B:
Deduce the name of the functional group present in X.
The \(^{\text{1}}{\text{H}}\,{\text{NMR}}\) spectrum of X shows three peaks. State the information that can be obtained from the number of peaks.
The \(^{\text{1}}{\text{H}}\,{\text{NMR}}\) spectrum of X includes peaks at 2.0 and 4.1 ppm. Use Table 18 of the Data Booklet to suggest the chemical shift of the third peak and state its relative peak area. Show your answers in the table below.
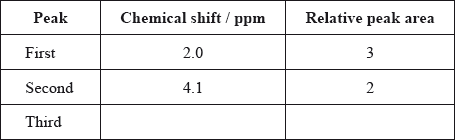
Deduce a possible structure for X that is consistent with the mass, IR and \(^{\text{1}}{\text{H}}\,{\text{NMR}}\) spectra.
The mass spectrum and infrared (IR) spectrum of a compound are shown below.
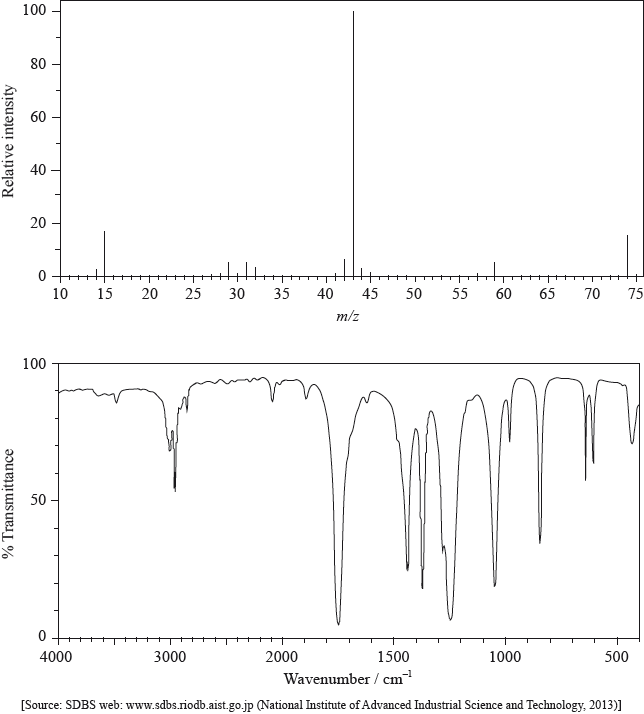
(i) State the information about this particular compound that can be derived from the mass spectrum and outline how it is found.
(ii) Suggest how the fragment with m/z = 43 is formed from the original molecule.
(i) Use the IR spectrum in the region 1600 – 1800 \({\text{c}}{{\text{m}}^{ - 1}}\) to deduce one functional group that is present in the compound and one group that is absent.
Present:
Absent:
(ii) The molecular formula of the compound is \({{\text{C}}_{\text{3}}}{{\text{H}}_{\text{6}}}{{\text{O}}_{\text{2}}}\). Explain, with reference to another region of the IR spectrum, why the compound could not be propanoic acid, \({\text{C}}{{\text{H}}_{\text{3}}}{\text{C}}{{\text{H}}_{\text{2}}}{\text{COOH}}\).
(iii) Deduce the structures of two possible isomers of propanoic acid consistent with the IR spectrum.
\(^{\text{1}}{\text{H}}\,{\text{NMR}}\) spectroscopy is often very useful in distinguishing between closely related compounds such as those above.
(i) State the region of the electromagnetic spectrum that is used in this technique.
(ii) The structures of two other closely related compounds are shown below.
Discuss how you would expect the \(^{\text{1}}{\text{H}}\,{\text{NMR}}\) spectra of these two compounds to differ, using Table 18 of the Data Booklet.
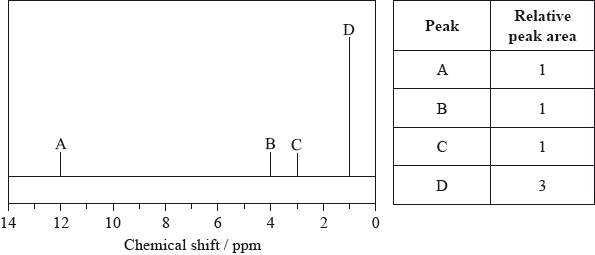
The mass spectrum of an unknown acidic compound, X, with empirical formula \({\text{C}}{{\text{H}}_{\text{2}}}{\text{O}}\), is shown below.
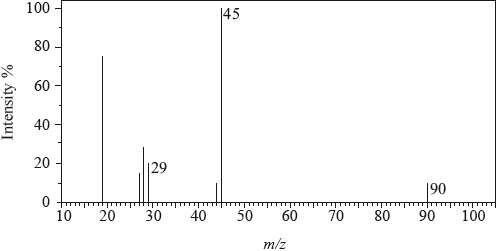
The low-resolution \(^{\text{1}}{\text{H}}\,{\text{NMR}}\) spectrum of X shows four peaks. A simplified representation is shown alongside a table with relative peak areas.
Determine the relative molecular mass, to the nearest integer, of the compound from the mass spectrum and deduce the formula of the molecular ion.
Deduce the formula of the fragment responsible for the peak at 45.
Deduce the formula of the fragment responsible for the peak at 29.
Identify the group responsible for the peak at D.
Suggest a possible structure for X.
Compound P contains a carbonyl group (C=O) and has the molecular formula C3H6O.
Pentan-2-one has the following mass spectrum.
Draw the two possible structures of compound P.
Explain why the infrared spectra of the structures in (a) are very similar.
Explain how the mass spectra of the structures in (a) can be used to distinguish between them.
Deduce the formulas of the species with the m/z values at 86, 71 and 43.
\(m{\text{/}}z = 86\):
\(m{\text{/}}z = 71\):
\(m{\text{/}}z = 43\):
Suggest a reason for the peak at m/z = 43 having an exceptionally high relative abundance.
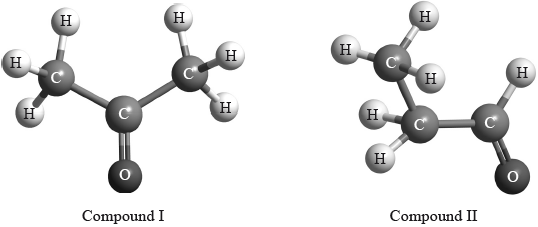
The \(^{\text{1}}{\text{H}}\,{\text{NMR}}\) spectrum of X with molecular formula \({{\text{C}}_{\text{3}}}{{\text{H}}_{\text{6}}}{\text{O}}\) is shown below.
The infrared and mass spectra for X were also recorded.
Deduce which of the following compounds is X and explain your answer.
\({\text{C}}{{\text{H}}_{\text{3}}}\)–CO–\({\text{C}}{{\text{H}}_{\text{3}}}\) \({\text{C}}{{\text{H}}_{\text{3}}}\)–\({\text{C}}{{\text{H}}_{\text{2}}}\)–CHO \({\text{C}}{{\text{H}}_{\text{2}}}\)–CH–\({\text{C}}{{\text{H}}_{\text{2}}}{\text{OH}}\)
Compound:
Explanation:
Deduce which one of the peaks in the \(^{\text{1}}{\text{H}}\,{\text{NMR}}\) spectrum of X would also occur in the spectrum of one of the other isomers, giving your reasoning.
Apart from absorptions due to C–C and C–H bonds, suggest one absorption, in wavenumbers, that would be present in the infrared spectrum.
Apart from absorptions due to C–C and C–H bonds, suggest one absorption, in wavenumbers, absent in this infrared spectrum but present in one of the other compounds shown in part (a).
Suggest the formulas and m/z values of two species that would be detected in the mass spectrum.
Species:
m/z:
Species:
m/z:
The IR spectrum below represents one of the three organic compounds: propan-1-ol (CH3CH2CH2OH), propanal (CH3CH2CHO) or propanoic acid (CH3CH2COOH).
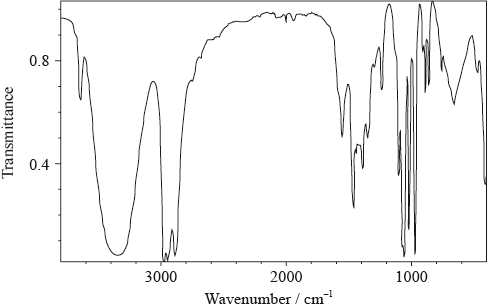
Analyse the spectrum and identify two bonds other than C–H that are present and one that is absent in this compound. Refer to Table 17 of the Data booklet to complete the table.
Bonds present:
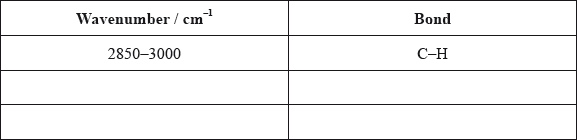
Bond absent:

The mass spectrum of the same compound contains strong peaks of \({({M_{\text{r}}} - 15)^ + }\) and \({({M_{\text{r}}} - 17)^ + }\) ions. The first signal corresponds to the loss of a methyl group, \({\text{C}}{{\text{H}}_{\text{3}}}\), from the molecule. Deduce which fragment is lost to produce the second peak.
Using the information above, deduce the identity of the organic compound.
Predict the number of peaks in the \(^{\text{1}}{\text{H}}\,{\text{NMR}}\) spectrum of this compound.
The mass spectrum of iodoethane, \({{\text{C}}_{\text{2}}}{{\text{H}}_{\text{5}}}{\text{I}}\), shows three prominent peaks with m/z values of 156, 127 and 29. Identify the ions responsible for each of these three prominent peaks.
Bromine contains two isotopes, \(^{{\text{79}}}{\text{Br}}\) and \(^{{\text{81}}}{\text{Br}}\), in approximately equal amounts. Predict the m/z values of the prominent peaks in the mass spectrum of bromoethane, \({{\text{C}}_{\text{2}}}{{\text{H}}_{\text{5}}}{\text{Br}}\).
Three isomers of \({{\text{C}}_{\text{3}}}{{\text{H}}_{\text{6}}}{{\text{O}}_{\text{2}}}\) are ethyl methanoate, methyl ethanoate and propanoic acid.
Explain which of the three compounds has an infrared spectrum with a broad absorption between 2500–3300 cm–1 and an absorption at 1730 cm–1.
Nuclear magnetic resonance (NMR) and mass spectrometry are diagnostic techniques often used in the identification of organic compounds.
Deduce two similarities and one difference in the \(^{\text{1}}{\text{H}}\,{\text{NMR}}\) spectra of the two isomers \({\text{C}}{{\text{H}}_{\text{3}}}{\text{COOH}}\), a carboxylic acid, and \({\text{HCOOC}}{{\text{H}}_{\text{3}}}\), an ester. \(^{\text{1}}{\text{H}}\,{\text{NMR}}\) data are given in Table 18 of the Data Booklet.
Similarities:
Difference:
The mass spectrum of one of the two isomers above has significant peaks at mass to charge ratios of 15, 45 and 60, while the other isomer has peaks at 15, 29, 31 and 60. Analyse these fragmentation patterns in the two mass spectra in order to distinguish between the two isomers.
Infrared (IR) spectroscopy is widely used as a technique in analytical chemistry.
The IR spectrum, mass spectrum and \(^{\text{1}}{\text{H}}\,{\text{NMR}}\) spectrum of an unknown compound, X, of molecular formula \({{\text{C}}_{\text{3}}}{{\text{H}}_{\text{6}}}{{\text{O}}_{\text{2}}}\) are as follows.
Explain what happens at a molecular level during the absorption of IR radiation by carbon dioxide, CO2.
(i) Identify the bonds responsible for the peaks A, B and C in the IR spectrum of X.
A:
B:
C:
(ii) In the mass spectrum of X, deduce which ions the m/z values at 74, 45 and 29 correspond to.
m/z = 74:
m/z = 45:
m/z = 29:
(iii) Identify the peak at 11.73 ppm in the \(^{\text{1}}{\text{H}}\,{\text{NMR}}\) spectrum.
(iv) Deduce the structure of X.
\(^{\text{1}}{\text{H}}\,{\text{NMR}}\) and IR spectroscopy both involve the absorption of electromagnetic radiation.
Identify the region of the electromagnetic spectrum used in \(^{\text{1}}{\text{H}}\,{\text{NMR}}\) spectroscopy.
Identify which of these two techniques involves higher energy radiation.
Two students were provided with three different isomers of \({{\text{C}}_{\text{3}}}{{\text{H}}_{\text{6}}}{{\text{O}}_{\text{2}}}\).
They were asked to suggest how the isomers could be distinguished and positively identified from each other using spectroscopic techniques. Student A said that they could be positively identified just from their infrared spectra. Student B said that they could be positively identified just from the number of peaks and the areas under each peak in their \(^{\text{1}}{\text{H}}\,{\text{NMR}}\) spectra.
Evaluate these two claims and suggest how any possible limitations could be overcome using the same spectroscopic technique.
Student A / Infrared:
Student B / \(^{\text{1}}{\text{H}}\,{\text{NMR}}\):
Describe the essential difference between the emission spectrum of sodium and the absorption spectrum of sodium.
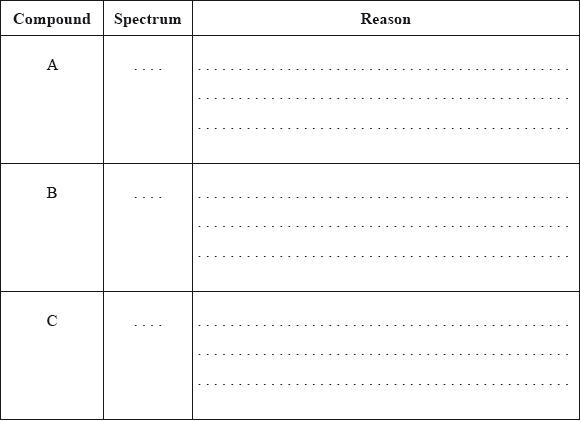
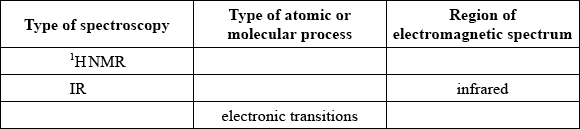
Identify the five missing components in the following table.
Three isomers of \({{\text{C}}_{\text{3}}}{{\text{H}}_{\text{6}}}{{\text{O}}_{\text{2}}}\) are ethyl methanoate, methyl ethanoate and propanoic acid.
Explain which of the three compounds has a \(^{\text{1}}{\text{H}}\,{\text{NMR}}\) spectrum showing two peaks with equal areas under each peak.
A class was determining the concentration of aqueous sodium hydroxide by titrating it with hydrochloric acid, whilst monitoring the pH of the solution. The sodium hydroxide solution was added into a glass beaker from a measuring cylinder and the hydrochloric acid added using a burette. One group of students accidentally used a temperature probe rather than a pH probe. Their results are given below.
Volume of aqueous NaOH = 25.0 ± 0.5 cm3
Concentration of HCl = 1.00 ± 0.01 mol dm−3

State and explain how the graph would differ if 1 mol\(\,\)dm−3 sulfuric acid had been used instead of 1 mol\(\,\)dm−3 hydrochloric acid.
A class was determining the concentration of aqueous sodium hydroxide by titrating it with hydrochloric acid, whilst monitoring the pH of the solution. The sodium hydroxide solution was added into a glass beaker from a measuring cylinder and the hydrochloric acid added using a burette. One group of students accidentally used a temperature probe rather than a pH probe. Their results are given below.
Volume of aqueous NaOH = 25.0 ± 0.5 cm3
Concentration of HCl = 1.00 ± 0.01 mol dm−3
Calculate the percentage uncertainty of the volume of the aqueous sodium hydroxide.
Suggest how the precision of this measurement could be improved.
Opiates have been used for thousands of years to alleviate pain. The structures of opiates are found in section 37 of the data booklet.
Diamorphine (heroin) can be synthesized from morphine. Identify the reagent necessary for this reaction and the by-product of this reaction.

The reaction can be monitored by infrared spectroscopy. Using section 26 of the data booklet, identify two IR absorbance ranges that would help distinguishing the two compounds.
Present in morphine but not in diamorphine:
Present in diamorphine but not in morphine:
Discuss how the differences in structure between morphine and diamorphine affect their absorption in the body.
A class was determining the concentration of aqueous sodium hydroxide by titrating it with hydrochloric acid, whilst monitoring the pH of the solution. The sodium hydroxide solution was added into a glass beaker from a measuring cylinder and the hydrochloric acid added using a burette. One group of students accidentally used a temperature probe rather than a pH probe. Their results are given below.
Volume of aqueous NaOH = 25.0 ± 0.5 cm3
Concentration of HCl = 1.00 ± 0.01 mol dm−3
The graph of temperature against titre can be used to calculate the concentration of alkali without knowing the concentration of the hydrochloric acid, using the enthalpy of neutralization.
Explain how the concentration may be calculated in this way.
Heat losses would make this method less accurate than the pH probe method. Outline why the thermometric method would always give a lower, not a higher, concentration.
Suggest how heat loss could be reduced.
State one other assumption that is usually made in the calculation of the heat produced.
Suggest why scientists often make assumptions that do not correspond to reality.
Outline why the thermochemical method would not be appropriate for 0.001 mol\(\,\)dm−3 hydrochloric acid and aqueous sodium hydroxide of a similar concentration.
Antacids react with hydrochloric acid in the stomach to relieve indigestion. A student investigated different brands of antacid to see which caused the largest increase in pH in a given time. She added the antacids to hydrochloric acid, and recorded the change in pH over five minutes.

State an equation for the reaction of magnesium hydroxide with hydrochloric acid.
Suggest two variables, besides the time of reaction, which the student should have controlled in the experiment to ensure a fair comparison of the antacids.
Calculate the uncertainty in the change in pH.
The student concluded that antacid B was the most effective, followed by A then C and finally D. Discuss two arguments that reduce the validity of the conclusion.
A class was determining the concentration of aqueous sodium hydroxide by titrating it with hydrochloric acid, whilst monitoring the pH of the solution. The sodium hydroxide solution was added into a glass beaker from a measuring cylinder and the hydrochloric acid added using a burette. One group of students accidentally used a temperature probe rather than a pH probe. Their results are given below.
Volume of aqueous NaOH = 25.0 ± 0.5 cm3
Concentration of HCl = 1.00 ± 0.01 mol dm−3
Suggest how the end point of the titration might be estimated from the graph.
Solubility plays an important role in the bioavailability of drugs in the body.
Suggest why aspirin is slightly soluble in water. Refer to section 37 of the data booklet.
Formulate an equation for the conversion of aspirin to a more water soluble derivative.
A student prepares aspirin from salicylic acid in the laboratory, extracts it from the reaction mixture, ensures the sample is dry and determines its melting point.

Suggest why the melting point of the student’s sample is lower and not sharp compared to that of pure aspirin.
Organic molecules can be characterized using infrared (IR) spectroscopy.
Compare and contrast the infrared peaks above 1500 cm−1 in pure samples of aspirin and salicylic acid using section 26 of the data booklet.


The pharmaceutical industry is one of the largest producers of waste solvents.
State a green solution to the problem of organic solvent waste.
Disposable plastic lighters contain butane gas. In order to determine the molar mass of butane, the gas can be collected over water as illustrated below:

List the data the student would need to collect in this experiment.
Explain why this experiment might give a low result for the molar mass of butane.
Suggest one improvement to the investigation.
The development of materials with unique properties is critical to advances in industry.
Low density polyethene (LDPE) and high density polyethene (HDPE) are both addition polymers.
Outline two properties a substance should have to be used as liquid-crystal in a liquid-crystal display.
Describe how the structures of LDPE and HDPE affect one mechanical property of the plastics.
One of the two infrared (IR) spectra is that of polyethene and the other of polytetrafluoroethene (PTFE).

Deduce, with a reason, which spectrum is that of PTFE. Infrared data is given in section 26 of the data booklet.
Many plastics used to be incinerated. Deduce an equation for the complete combustion of two repeating units of PVC, (–C2H3Cl–)2.
In order to provide safe drinking water, a water supply is often treated with disinfectants, which aim to inactivate disease-causing bacteria in the water.
To compare the effectiveness of different disinfectants, a CT value is used as a measure of the dosage of disinfectant needed to achieve a certain level of inactivation of specific bacteria.
CT value (mg min dm−3) = C (mg dm−3) concentration of disinfectant × T (min) contact time with water
The table below compares the CT values of different disinfectants necessary to achieve 99% inactivation of two types of bacteria, listed as A and B.

(i) Deduce the oxidation state of chlorine in the following disinfectants.

(ii) From the data on CT values, justify the statement that bacterium B is generally more resistant to disinfection than bacterium A.
(iii) CT values can be used to determine whether a particular treatment process is adequate. Calculate the CT value, in mg min dm−3, when 1.50 × 10⁻⁵ g dm−3 of chlorine dioxide is added to a water supply with a contact time of 9.82 minutes.
(iv) From your answer to (a) (iii) and the data in the table, comment on whether this treatment will be sufficient to inactivate 99% of bacterium A.
CT values are influenced by temperature and by pH. The table below shows the CT values for chlorine needed to achieve 99% inactivation of a specific bacterium at stated values of pH and temperature.

(i) With reference to the temperature data in the table, suggest why it may be more difficult to treat water effectively with chlorine in cold climates.
(ii) Sketch a graph on the axes below to show how the CT value (at any temperature) varies with pH.

(iii) Comment on the relative CT values at pH 6.0 and pH 9.0 at each temperature.
(iv) Chlorine reacts with water as follows:
Cl2 (g) + H2O (l) \( \rightleftharpoons \) HOCl (aq) + HCl (aq)
HOCl (aq) \( \rightleftharpoons \) OCl− (aq) + H+ (aq)
Predict how the concentrations of each of the species HOCl (aq) and OCl− (aq) will change if the pH of the disinfected water increases.

Despite widespread improvements in the provision of safe drinking water, the sale of bottled water has increased dramatically in recent years. State one problem caused by this trend.
Infrared (IR) spectra can be used to distinguish between various types of plastics. Some simplified IR spectra are given here.

Explain, with a reference to molecular structure, which two of the plastics can not be distinguished by IR spectroscopy.
Infrared (IR) spectroscopy is often used for the identification of polymers, such as PETE, for recycling.
LDPE and high density polyethene (HDPE) have very similar IR spectra even though they have rather different structures and physical properties.
Below are the IR spectra of two plastics (A and B); one is PETE, the other is low density polyethene (LDPE).

Deduce, giving your reasons, the identity and resin identification code (RIC) of A and B using sections 26 and 30 of the data booklet.

Describe the difference in their structures.
Explain why the difference in their structures affects their melting points.
A student set up a simple voltaic cell consisting of a copper electrode and a zinc electrode dipped in sodium chloride solution.

The student gradually increased the distance, d, between the electrodes to study the effect on the initial current, I, passing through the light bulb.
The student hypothesized that the initial current would be inversely proportional to the distance between the electrodes.
The following data was collected over five trials.

The data did not support the student’s hypothesis. He investigated other possible relationships by plotting a graph of the average current against the distance between the electrodes. He obtained the following best-fit line with a correlation coefficient (r) of −0.9999.

Sketch a graph that would support the student’s hypothesis.

Suggest what the correlation coefficient of −0.9999 indicates.
State the equation of the straight line obtained using the data.
Outline how current flows in the sodium chloride solution.
The absorption of infrared (IR) radiation by molecules in the atmosphere affects global temperatures.

Using the graph, state, giving your reasons, whether or not oxygen and ozone are greenhouse gases.
There is a link between world energy consumption and carbon dioxide production.
Climate induced changes in the ocean can be studied using measurements such as the Atmospheric Potential Oxygen (APO). Trends in APO concentration from two stations, one in each hemisphere, are shown below.

Trends in atmospheric potential oxygen (APO) based on monthly averages between 1990 and 2010.
[Source: www.ioos.noaa.gov]
The following graph represents world energy consumption by type for the years 1988–2013.

Estimate the percentage of energy consumption which did not directly produce CO2 in 2013.
O2 is consumed in producing CO2 for electricity generation. The graph shows the relationship between the world’s electricity generation and CO2 production between 1994 and 2013.

Calculate the mass, in million tonnes, of oxygen gas ultimately found in CO2 which is consumed in generating 18\(\,\)000 terawatts of electricity using the equation given for the best fit line. Give your answer to 2 significant figures.
Assume coal is the only energy source.
The equilibrium expression for O2 exchange between the atmosphere and ocean is O2(g) \( \rightleftharpoons \) O2(aq). Identify one factor which shifts the equilibrium to the right.
Factors such as photosynthesis and respiration are excluded so that APO is influenced by oceanic changes only. Suggest why the seasonal cycles from Alert station and Cape Grim observatory are different.
The change in APO O2/N2 ratio, per meg, is measured relative to an O2/N2 reference.
\[\Delta {\text{(}}{{\text{O}}_{\text{2}}}{\text{/}}{{\text{N}}_{\text{2}}}{\text{)}} = \left( {\frac{{{{({{\text{O}}_2}/{{\text{N}}_2})}_{{\text{sample}}}}}}{{{{({{\text{O}}_2}/{{\text{N}}_2})}_{{\text{reference}}}}}} - 1} \right) \times {10^6}\]
Calculate the APO Δ(O2/N2) value for an oxygen concentration of 209\(\,\)400 ppm assuming that any change in N2 concentration is negligible. Reference values for O2 and N2 are 209 460 and 790 190 ppm respectively.
Suggest a reason for the general negative gradient of the APO curve given in (c).
Sodium chloride, NaCl, can be spread on icy roads to lower the freezing point of water.
The diagram shows the effects of temperature and percentage by mass of NaCl on the composition of a mixture of NaCl and H2O.

Estimate the lowest freezing point of water that can be reached by adding sodium chloride.
Estimate the percentage by mass of NaCl dissolved in a saturated sodium chloride solution at +10 ºC.
Calculate the percentage of water by mass in the NaCl•2H2O crystals. Use the data from section 6 of the data booklet and give your answer to two decimal places.
Suggest a concern about spreading sodium chloride on roads.